The road to green, 2023
UK cities leading the EV charge
Transport is the biggest contributor to greenhouse gas emissions in the UK. That’s why the switch to electric vehicles is a key target in the government’s net-zero strategies, making up 23% of the total reduction in emissions expected by 2050.
The sale of new petrol and diesel cars is set to end by 2030. But how are we tracking the electric vehicle (EV) transition? We combined a variety of key metrics to uncover an EV-readiness index that reveals which UK cities and towns are leading the way.
Economic upsides to the EV transition
The environmental agenda has largely driven the transition to EVs, but there are economic benefits too.
-
Jobs: the national shift to net-zero will have flow-on benefits through the jobs market. Charging infrastructure firms are hiring, and schemes like the government’s investment in mass-scale production of EV batteries will create thousands of green jobs.
-
Lower transport costs: compared to a petrol car, drivers can save over £650 a year on fuel.
-
Free parking: EVs are eligible for free parking while charging in many municipalities.
-
Tax savings: until 2025, zero-emission electric cars are exempt from paying vehicle road tax. After that point, their tax rate will depend on their retail price and emissions level.
-
Avoid congestion charge: electric vehicles usually don’t pay congestion fees, though this is subject to change as EVs are becoming more common.
-
Cheaper long-term: EVs can cost 40% less than a traditional car over their life, even though they’re normally more expensive to buy.
-
Good resale value: interest in EVs is high, so their value is holding up well and is expected to stay steady as the age of 100% EVs approaches. Of course, resale depends on many factors. See this EV depreciation guide for trends on many popular models.
Electric vehicle boom in the UK
Before we dive into which cities are making the most progress in the EV transition, let’s first look at the latest EV trends in the UK.
We’ve focused on 100% battery electric vehicles (BEV) and excluded hybrids as they will be phased out in the transition to zero-emission transport.
2021 BEV sales
Year-on-year BEV increase 2020-2021
Number of BEVs on the road
BEVs as a % of new car registrations
Source: SMMT data to September 2022
How the EV-readiness index works
We analysed a range of key metrics to rank UK cities and towns in their progress toward an electric vehicle future.
BEV sales
New and used BEV sales data trends by location
Charger availability
Number of chargers available per person
Clean air policy
Have or plan to introduce fossil fuel disincentive
The UK cities and towns leading the charge toward an EV future
Let’s take a look at the top 10 for 2022.
London
London has been named as the city leading the charge to an electric vehicle future in the UK
Our capital claimed the highest EV-readiness ranking out of all UK cities. The switch to electric is well underway in London, with flourishing new and used EV sales, and the percentage of BEVs amongst new vehicle registrations is nudging 25%.
London is also leading the way in charging infrastructure with 8,600 public charge points for its 9 million residents. At the end of 2021, this represented a third of the UK’s total charge points and an 85% increase since 2019.
Clean air has been a priority for London’s policymakers since 2008 when they launched a low-emission zone. It was upgraded to the world’s first 24-hour ultra-low emission zone in 2019, and it’s poised to expand again in 2023.
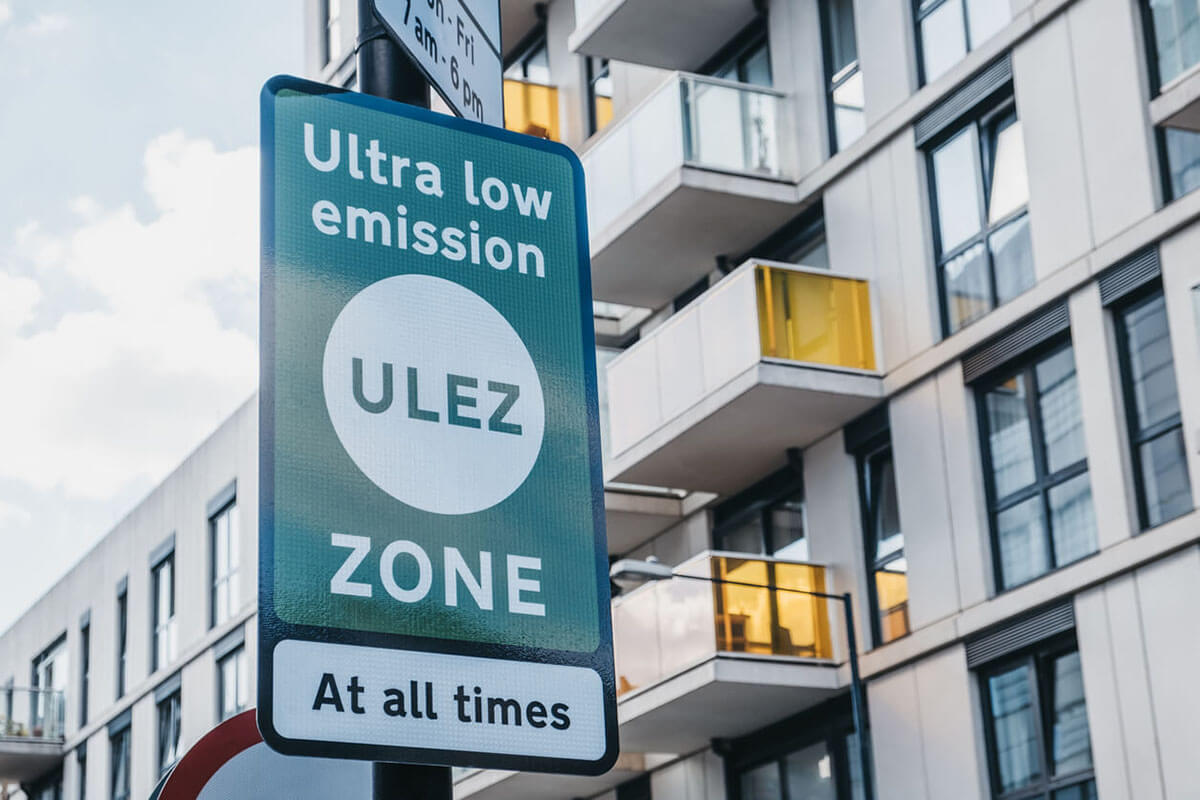
Credit: Flickr
Nottingham
Nottingham achieves second place in our list of cities most prepared for the EV switch
Nottingham is well-advanced in their transition to zero-carbon transport, with solid results across the metrics of the EV-readiness index. EV sales are climbing steadily, and with the UK’s second most charging stations outside of the capital, Nottingham’s EV drivers can easily recharge while out and about.
Lack of trust in EV driving range and accessibility to charging points are key barriers to EV adoption, and Nottingham is addressing those concerns head-on.
They are also driving the switch to EVs with innovative schemes like wireless charging of electric taxis and on-street EV charging.
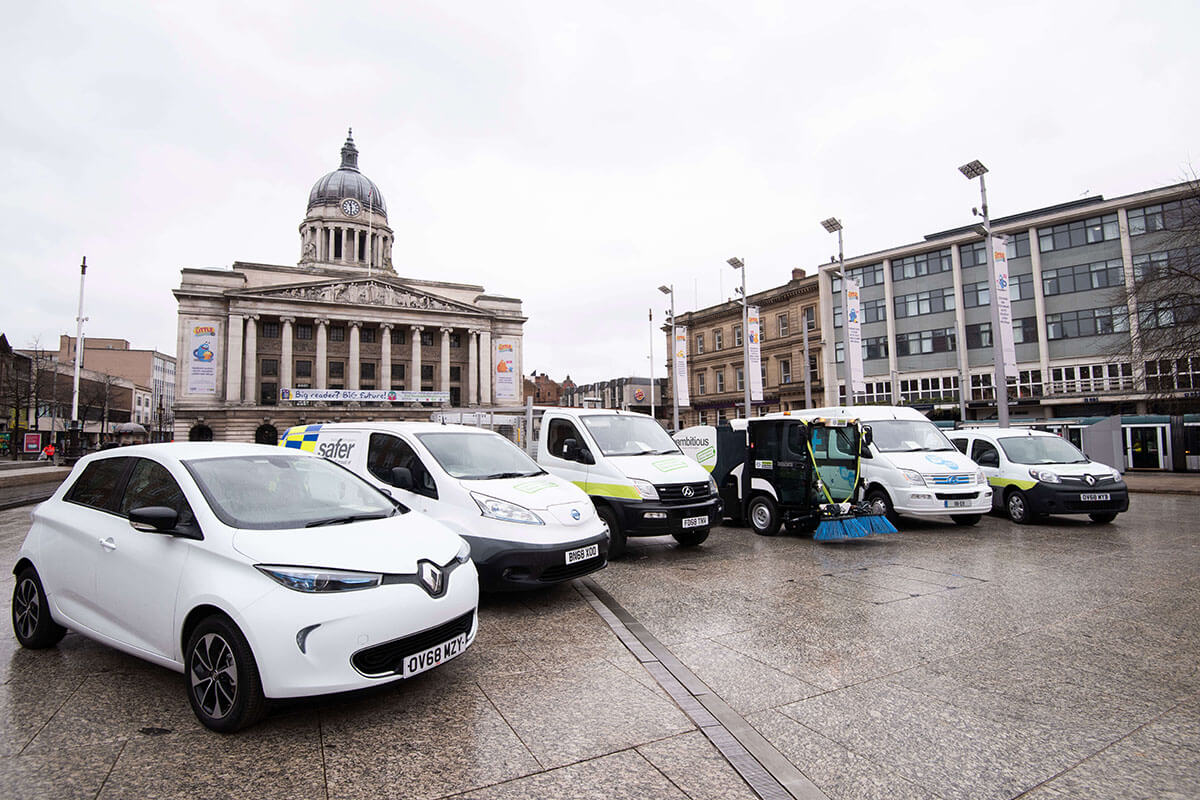
Credit: https://www.transportnottingham.com/
Bedford
Bedford scores a podium finish in the race to EV-readiness
Bedford has been a leader in climate action since it declared a climate emergency in 2019. Now, it takes third place in our EV-readiness challenge.
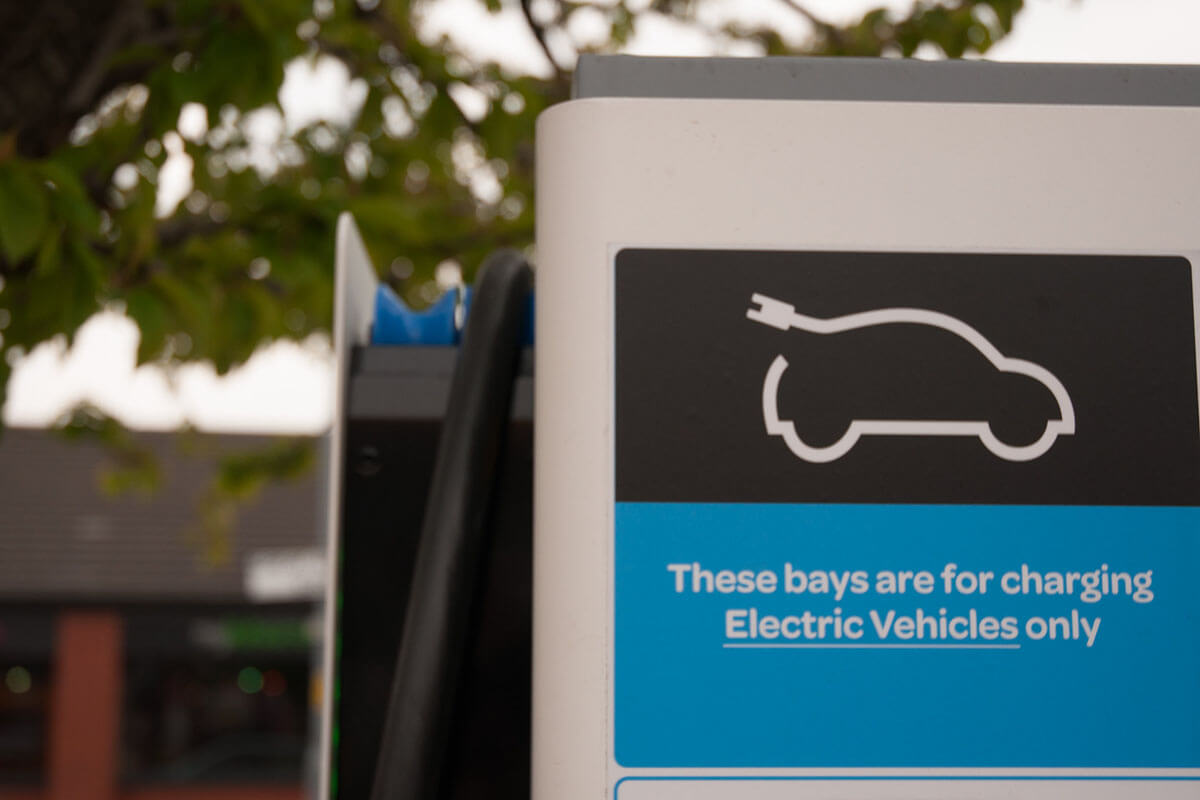
Bedford Borough Council has developed an extensive Net-Zero Strategy making installing charge points a key focus. Their innovations include a policy requiring developers to install EV infrastructure in new homes, businesses and community facilities.
Electric vehicle sales exhibit strong growth, and many education campaigns are in place to support the switch. For example, the local council offers online EV webinars to demonstrate EV options and advantages to Bedfordshire businesses.
Credit: www.jct600.co.uk/electric/
Manchester
Manchester was named 4th in the list of cities most prepared for an electric vehicle future
In Manchester, the switch to electric vehicles is gathering pace with strong sales in both new and used BEVs.
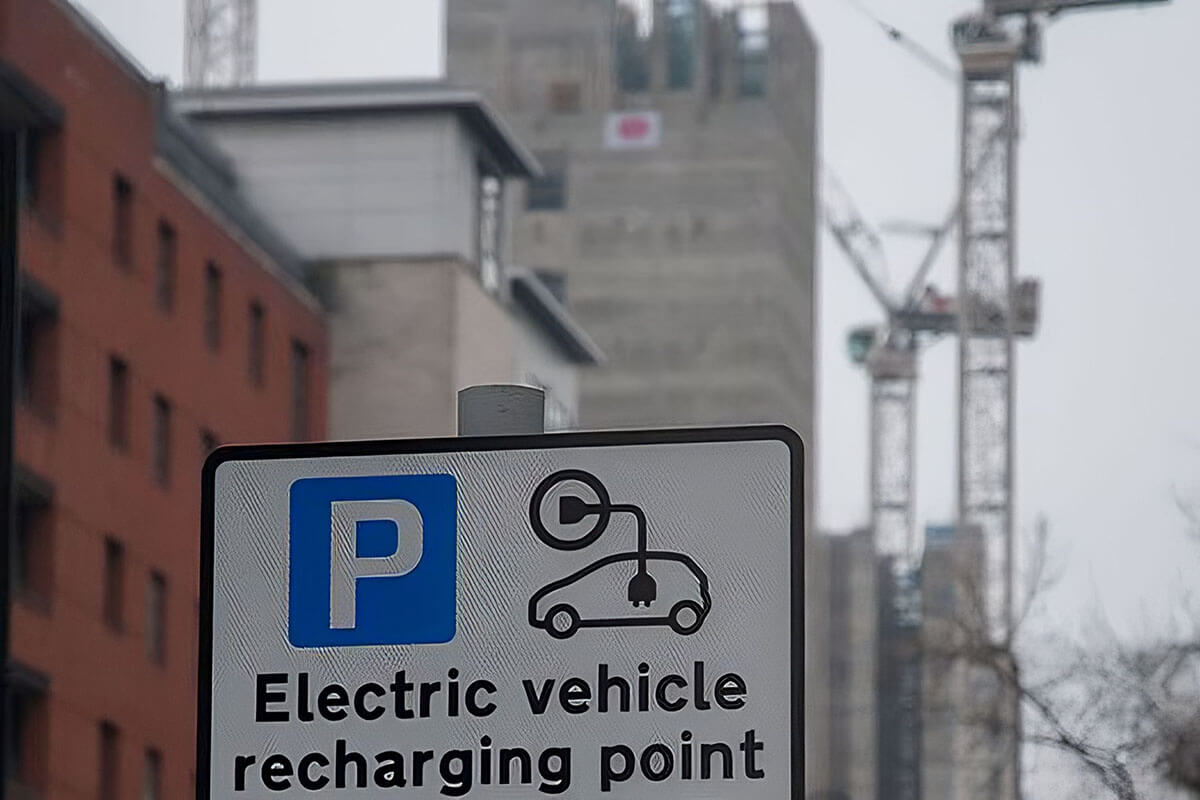
Government data indicates EV charging infrastructure installation is progressing well, with the number of EV charge points available for Mancunians among the best in the UK.
Manchester was to have a clean air zone in place by May 2022, but it’s now under review. Government feedback is required before the new investment-led Greater Manchester clean air plan can be implemented.
Credit: www.jct600.co.uk/electric/
Newcastle upon Tyne
Newcastle claims 5th place in the race to an EV future
Newcastle is rapidly making the switch to electric vehicles with impressive results across the three metrics of our EV-readiness index.
Newcastle upon Tyne recently named an EV hotspot, as the UK city with the most electric cars financed in 2022.
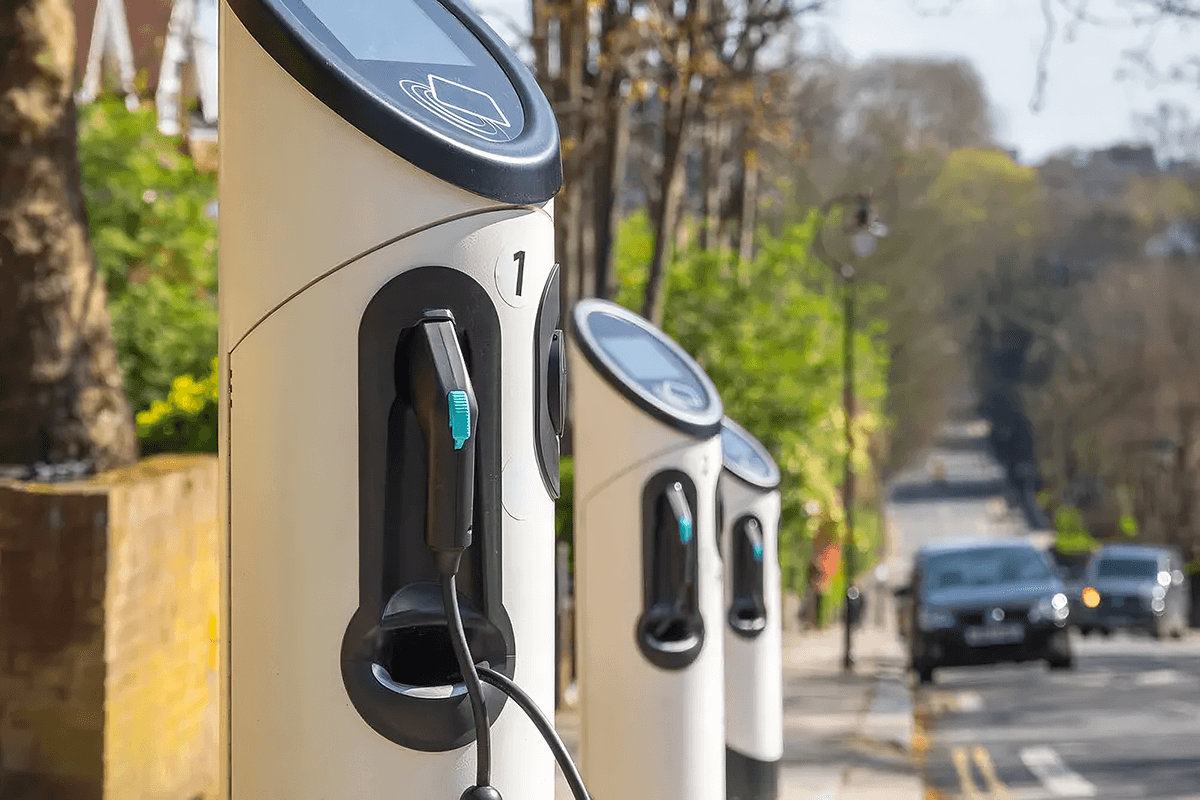
Readily accessible charging infrastructure is critical to give motorists confidence to switch to EVs. Data shows there are less than 900 people per charger in Newcastle upon Tyne, which puts charger availability among the best in the UK.
A clean air zone has been established in parts of Newcastle. It comes into place in 2023, and will only apply to buses, coaches, taxis, vans and heavy goods vehicles that do not meet national Clean Air Zone emissions standards. Private cars will be exempt from the associated charges.
Credit: https://www.flash-electrical.co.uk/
Milton Keynes
Milton Keynes earns 6th place in a list of the UK’s top EV-ready cites
In 2014, Milton Keynes was awarded £9 million in funding in the Go Ultra Low Cities scheme. This boost to creating EV charging infrastructure has enabled Milton Keynes to become one of the UK’s best places for EV charging.
They also used the funding to educate residents, with the UK’s first all-EV, multi-brand car showroom opening in 2017. Now closed, it was an experience centre aimed at educating motorists on the benefits of EVs to help them confidently make the switch.
Milton Keynes also has a parking scheme to encourage EV uptake with dedicated free parking for ultra-low emission cars.

Credit: https://www.autocar.co.uk/
Bristol
Bristol named 7th most EV-ready city in the UK
The EV revolution is taking off in Bristol, with more and more drivers making the switch.
There are over 200 charging points available in Bristol in car parks, shopping centres and parks. In 2023, 150 further public charging points will be installed in residential areas, and grants are also available for installing charge points at home.
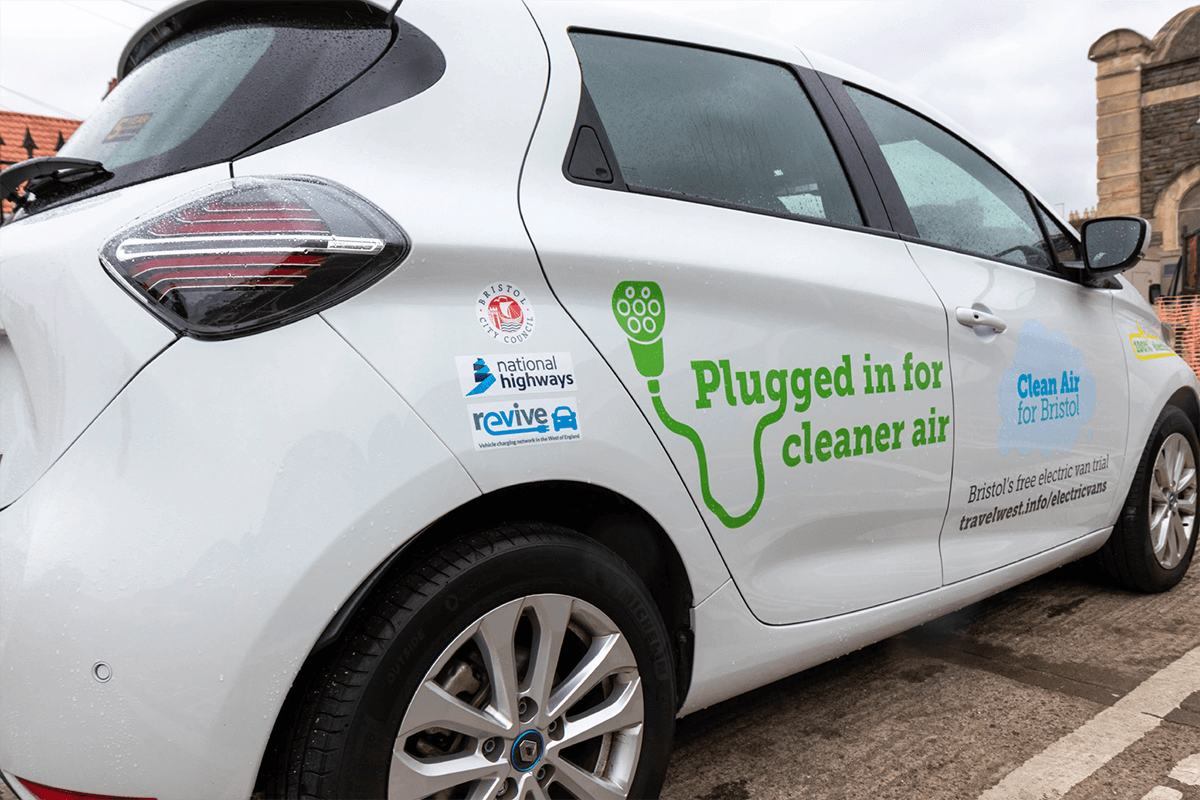
To further encourage the switch to EVs, Bristol City Council offers businesses, sole traders and other organisations a free 2-month trial of electric vans and cars. The launch of this scheme comes ahead of a clean air zone launching in November 2022.
Credit: https://travelwest.info/
Coventry
Coventry clinches 8th place in the UK’s EV revolution
Coventry is a leading EV-friendly hotspot, with one of the highest charger availability scores in the UK. They have taken advantage of government funding and have created innovative schemes like Plug-in Coventry which is one of the UK’s only truly open, fast-charging networks.
The electric vehicle revolution is at the heart of Coventry’s economic future. It’s home to the UK’s battery industrialisation centre, and there is also a new gigafactory in the pipeline. The gigafactory will help drive the world’s transition to sustainable transport by producing advanced lithium-ion batteries and creating up to 6,000 new jobs.
Credit: www.jct600.co.uk/electric/
Southampton
Southampton scores 9th place among the UK cities paving the way for more EV takeup
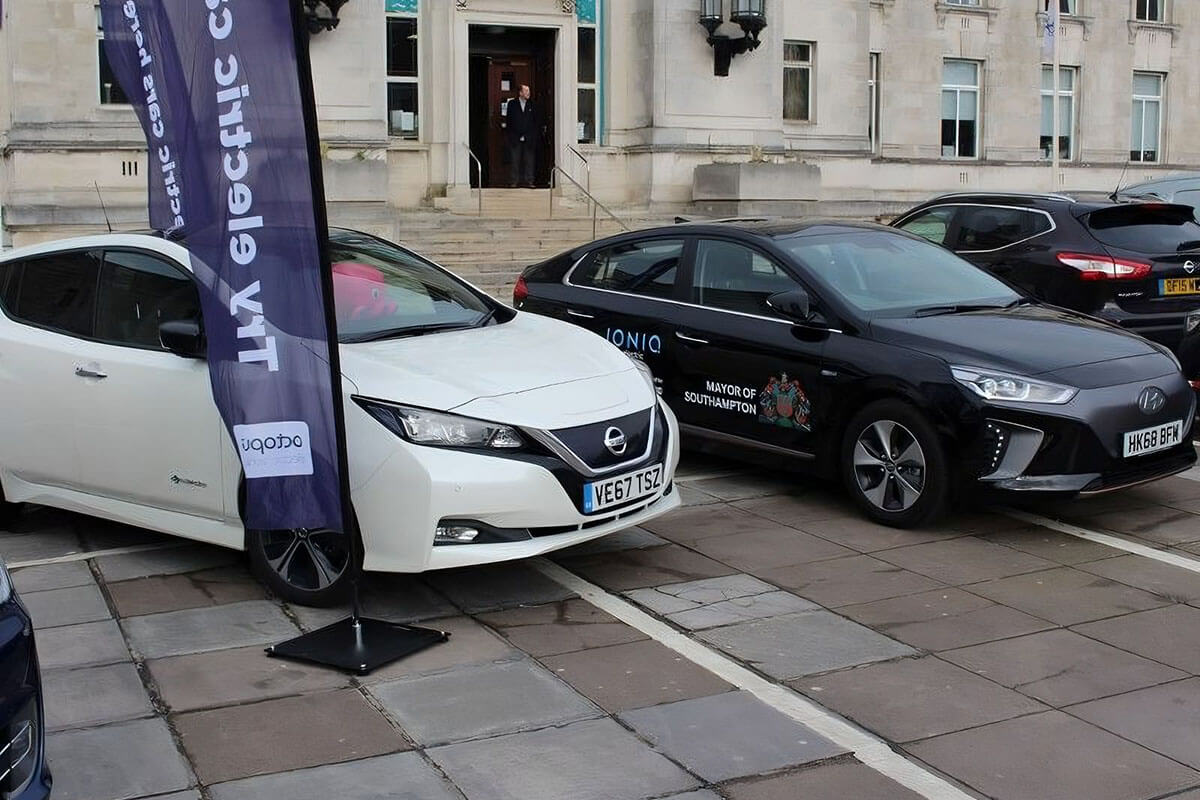
Southampton’s motorists are embracing the switch to EVs in record numbers. The south coast city recently ranked in second place in a list of UK cities with the most EVs financed in 2022.
The city council has developed a comprehensive green city plan which includes a goal to be in the top 10% of UK cities for public electric charge points by 2025. They offer a range of incentives to encourage residents and businesses to switch to EVs, including parking and tollway discounts.
Credit: https://www.southampton.gov.uk/
Oxford
Oxford earns 10th place in the UK cities most prepared for an EV future
Oxford residents have shown an enthusiastic takeup of EVs, with solid growth evident in new and used EV sales.
Oxford is home to Europe’s most powerful EV charging hub. The recently opened Energy Superhub Oxford offers ultra-rapid charging for 42 vehicles and is 100% powered by renewable energy.
A zero-emission zone pilot scheme has recently been established in Oxford to encourage people to switch to fully-electric vehicles. A city-centre trial was launched in February 2022, with plans to expand to a wider zone following further consultation.
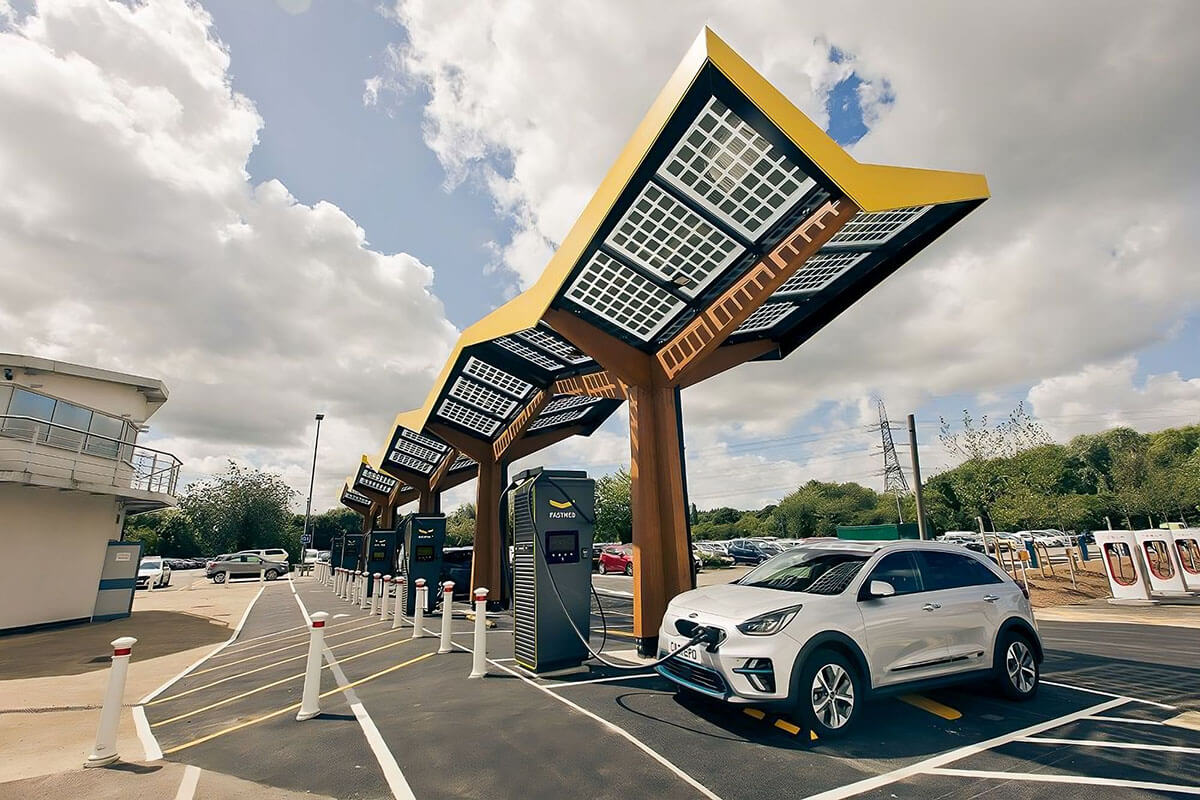
Credit: https://www.pivot-power.co.uk/
A special mention must go to the remaining towns and cities in the top twenty index.
Ranking highly in EV-readiness shows a deep commitment to the UK’s transport revolution, and these areas are all making efforts to provide charging points and incentives for fully-electric drivers.
- Brighton
- Solihull
- Leeds
- Warrington
- Banbury
- Derby
- Leicester
- Stafford
- Glasgow
- Barnsley
The full index
By gathering metrics on electric vehicle sales, charger availability and local clean air zones, we have created an index of those towns leading the charge to EV adoption. The full index is presented below.
| Seller Town | Electric Vehicle Sales Rank | Charger availability rank | People per charger | Combined EV rank |
|---|---|---|---|---|
| London | 1 | 15 | 1,672 | 1 |
| Nottingham | 5 | 7 | 943 | 2 |
| Bedford | 14 | 12 | 1,389 | 3 |
| Manchester | 7 | 13 | 1,423 | 4 |
| Newcastle upon Tyne | 26 | 6 | 863 | 5 |
| Milton Keynes | 19 | 5 | 810 | 6 |
| Bristol | 2 | 51 | 3,011 | 7 |
| Oxford | 49 | 31 | 2,226 | 8 |
| Coventry | 60 | 3 | 607 | 9 |
| Southampton | 9 | 46 | 2,798 | 10 |
| Brighton | 76 | 2 | 521 | 11 |
| Solihull | 20 | 39 | 2,533 | 12 |
| Leeds | 17 | 33 | 2,242 | 13 |
| Warrington | 31 | 25 | 2,094 | 14 |
| Banbury | 36 | 18 | 1,802 | 15 |
| Derby | 10 | 57 | 3,220 | 16 |
| Leicester | 19 | 70 | 3,855 | 17 |
| Stafford | 71 | 36 | 2,387 | 18 |
| Glasgow | 3 | 85 | 4,415 | 19 |
| Barnsley | 52 | 43 | 2,646 | 20 |
| Darlington | 43 | 44 | 2,717 | 21 |
| Bromley | 83 | 22 | 1,997 | 22 |
| Stockton-on-Tees | 92 | 8 | 987 | 23 |
| Loughborough | 52 | 29 | 2,140 | 24 |
| Birmingham | 6 | 121 | 7,751 | 25 |
| Chelmsford | 11 | 79 | 4,130 | 26 |
| Rochdale | 57 | 86 | 4,434 | 27 |
| Eastleigh | 76 | 11 | 1,356 | 28 |
| Hayes | 85 | 14 | 1,667 | 29 |
| St Albans | 25 | 87 | 4,451 | 30 |
| Northampton | 24 | 81 | 4,235 | 31 |
| Horsham | 48 | 61 | 3,431 | 32 |
| Reading | 11 | 97 | 5,300 | 33 |
| Norwich | 11 | 94 | 5,075 | 34 |
| Swindon | 18 | 78 | 4,125 | 35 |
| Wokingham | 42 | 77 | 4,114 | 36 |
| Aylesbury | 72 | 40 | 2,578 | 37 |
| Haywards Heath | 81 | 10 | 1,209 | 38 |
| Wilmslow | 52 | 76 | 4,069 | 39 |
| Wakefield | 63 | 58 | 3,291 | 40 |
| Maidstone | 35 | 68 | 3,711 | 41 |
| Falkirk | 44 | 93 | 5,044 | 42 |
| Newark | 98 | 23 | 2,006 | 43 |
| Slough | 75 | 83 | 4,310 | 44 |
| Peterborough | 55 | 82 | 4,299 | 45 |
| Chester | 43 | 67 | 3,621 | 46 |
| Middlesbrough | 38 | 88 | 4,460 | 47 |
| Hitchin | 33 | 106 | 6,017 | 48 |
| York | 67 | 35 | 2,365 | 49 |
| Fareham | 85 | 90 | 4,783 | 50 |
| Sevenoaks | 89 | 20 | 1,859 | 51 |
| Gloucester | 56 | 73 | 3,949 | 52 |
| Andover | 88 | 26 | 2,114 | 53 |
| Liverpool | 22 | 102 | 5,878 | 54 |
| Exeter | 75 | 49 | 2,872 | 55 |
| Ashford | 81 | 55 | 3,139 | 57 |
| Lincoln | 93 | 34 | 2,344 | 58 |
| Edinburgh | 13 | 124 | 8,611 | 59 |
| Oldham | 108 | 48 | 2,832 | 60 |
| Preston | 27 | 114 | 6,667 | 61 |
| Stanmore | 101 | 74 | 3,950 | 62 |
| Worcester | 70 | 64 | 3,505 | 63 |
| Ormskirk | 139 | 9 | 1,146 | 64 |
| Rochester | 106 | 38 | 2,519 | 65 |
| Chesterfield | 99 | 16 | 1,687 | 66 |
| Plymouth | 102 | 45 | 2,768 | 67 |
| Crawley | 34 | 115 | 6,943 | 68 |
| Guildford | 87 | 54 | 3,125 | 69 |
| Newbury | 147 | 4 | 806 | 70 |
| Cheltenham | 23 | 128 | 9,704 | 71 |
| Wellingborough | 50 | 100 | 5,620 | 72 |
| Leamington Spa | 114 | 37 | 2,486 | 73 |
| Stockport | 64 | 92 | 4,966 | 74 |
| Chorley | 120 | 27 | 2,118 | 75 |
| Keighley | 31 | 139 | 12,543 | 76 |
| Altrincham | 51 | 103 | 5,935 | 77 |
| Rugby | 56 | 118 | 7,315 | 78 |
| Ilford | 45 | 99 | 5,606 | 79 |
| Watford | 113 | 17 | 1,746 | 80 |
| Colchester | 56 | 91 | 4,874 | 81 |
| Widnes | 110 | 50 | 2,927 | 82 |
| Sheffield | 43 | 146 | 17,574 | 83 |
| Aberdeen | 97 | 71 | 3,856 | 84 |
| Maidenhead | 90 | 84 | 4,322 | 85 |
| Camberley | 118 | 69 | 3,804 | 86 |
| Croydon | 141 | 30 | 2,222 | 87 |
| Bolton | 75 | 56 | 3,141 | 88 |
| Salisbury | 107 | 42 | 2,632 | 89 |
| Rotherham | 134 | 47 | 2,800 | 90 |
| Huddersfield | 50 | 132 | 10,644 | 91 |
| Halifax | 51 | 131 | 10,328 | 92 |
| Sunderland | 134 | 21 | 1,874 | 93 |
| Newport | 59 | 101 | 5,790 | 94 |
| Wolverhampton | 88 | 98 | 5,379 | 95 |
| Bury | 116 | 53 | 3,052 | 96 |
| Ipswich | 77 | 104 | 5,961 | 97 |
| Bracknell | 105 | 75 | 4,005 | 98 |
| Worksop | 145 | 24 | 2,060 | 99 |
| Sale | 82 | 152 | 27,845 | 100 |
| Wrexham | 107 | 105 | 5,972 | 101 |
| Sutton | 102 | 116 | 6,948 | 102 |
| Romford | 68 | 125 | 8,636 | 103 |
| Cambridge | 87 | 60 | 3,371 | 104 |
| Hereford | 154 | 32 | 2,238 | 105 |
| Doncaster | 64 | 96 | 5,271 | 106 |
| Dundee | 120 | 41 | 2,591 | 107 |
| Harrow | 63 | 133 | 10,876 | 108 |
| Blackburn | 67 | 129 | 9,768 | 109 |
| Huntingdon | 35 | 147 | 17,735 | 110 |
| Hemel Hempstead | 59 | 145 | 17,126 | 111 |
| Kettering | 133 | 52 | 3,032 | 112 |
| Enfield | 80 | 142 | 13,899 | 113 |
| Basingstoke | 139 | 59 | 3,364 | 114 |
| Bishop's Stortford | 101 | 123 | 8,218 | 115 |
| Bradford | 118 | 107 | 6,236 | 116 |
| Eastbourne | 115 | 66 | 3,582 | 117 |
| Brentwood | 129 | 95 | 5,259 | 118 |
| Crewe | 84 | 80 | 4,198 | 119 |
| Warwick | 119 | 65 | 3,536 | 120 |
| Pinner | 122 | 62 | 3,459 | 121 |
| Worthing | 78 | 112 | 6,607 | 122 |
| Cannock | 110 | 117 | 7,177 | 123 |
| Sutton Coldfield | 76 | 144 | 15,290 | 124 |
| Bury Saint Edmunds | 144 | 63 | 3,502 | 125 |
| Harrogate | 89 | 143 | 14,843 | 126 |
| Macclesfield | 112 | 110 | 6,395 | 127 |
| Luton | 131 | 89 | 4,527 | 128 |
| Woking | 80 | 119 | 7,424 | 129 |
| Wigan | 121 | 134 | 10,963 | 130 |
| Telford | 114 | 138 | 12,332 | 131 |
| Bournemouth | 123 | 108 | 6,292 | 132 |
| Daventry | 153 | 72 | 3,941 | 133 |
| Tamworth | 103 | 130 | 10,246 | 134 |
| High Wycombe | 79 | 109 | 6,343 | 135 |
| Bexleyheath | 102 | 153 | 35,214 | 136 |
| Tadley | 121 | 136 | 11,473 | 137 |
| Cardiff | 86 | 120 | 7,581 | 138 |
| Wirral | 61 | 156 | 161,633 | 139 |
| Walsall | 109 | 149 | 19,127 | 140 |
| Grays | 133 | 111 | 6,411 | 141 |
| Swansea | 116 | 127 | 8,834 | 142 |
| Nuneaton | 142 | 113 | 6,621 | 143 |
| Stoke-on-Trent | 70 | 135 | 10,964 | 144 |
| Bridgwater | 118 | 141 | 13,759 | 145 |
| Barnet | 116 | 155 | 56,548 | 146 |
| Leatherhead | 143 | 126 | 8,709 | 147 |
| Northwich | 148 | 122 | 7,904 | 148 |
| Hull | 124 | 150 | 23,741 | 149 |
| Orpington | 126 | 148 | 18,063 | 150 |
| Harlow | 135 | 137 | 11,796 | 151 |
| Southport | 137 | 140 | 13,100 | 152 |
| Burton-on-Trent | 122 | 154 | 36,150 | 153 |
| Chatham | 140 | 151 | 25,170 | 154 |
Watch this space
With the 2030 deadline fast approaching, it’s encouraging to see these UK cities and towns embracing the electric vehicle revolution. Their residents enthusiastically adopt the technology, and many municipalities offer incentives and education to encourage motorists to make the switch. Congratulations to all the UK cities leading the charge. We’ll be following your progress with interest.